Project
Visualizing Emancipation
Office of Digital Humanities

Photo caption
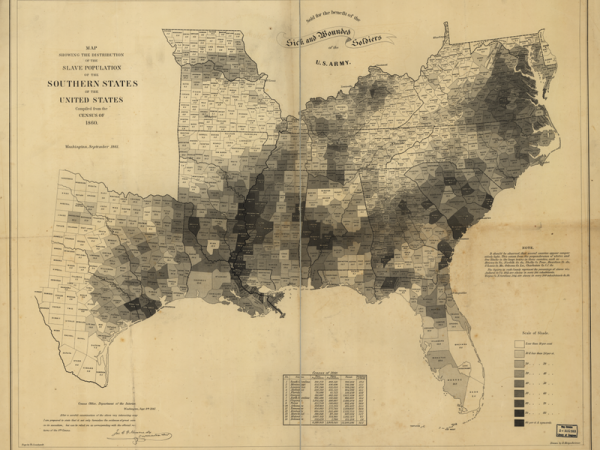
The U.S. Coast Survey map calculated the number of slaves in each county in the United States in 1860.
Courtesy of the Smithsonian Institution

Photo caption
The U.S. Coast Survey map calculated the number of slaves in each county in the United States in 1860.
Courtesy of the Smithsonian Institution
Trace the fall of slavery during the Civil War with this interactive online map of emancipation, drawn from events described in official military correspondence, newspapers, and wartime letters and diaries.