Mapping Texts: Visualizing Historical American Newspapers

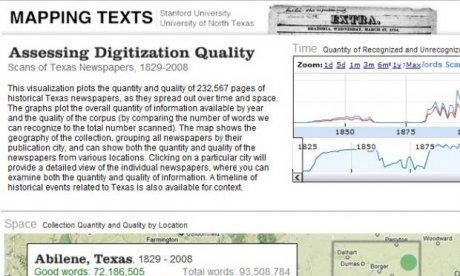
Assessing Digitization Quality
Image courtesy of University of North Texas / Stanford University

Assessing Digitization Quality
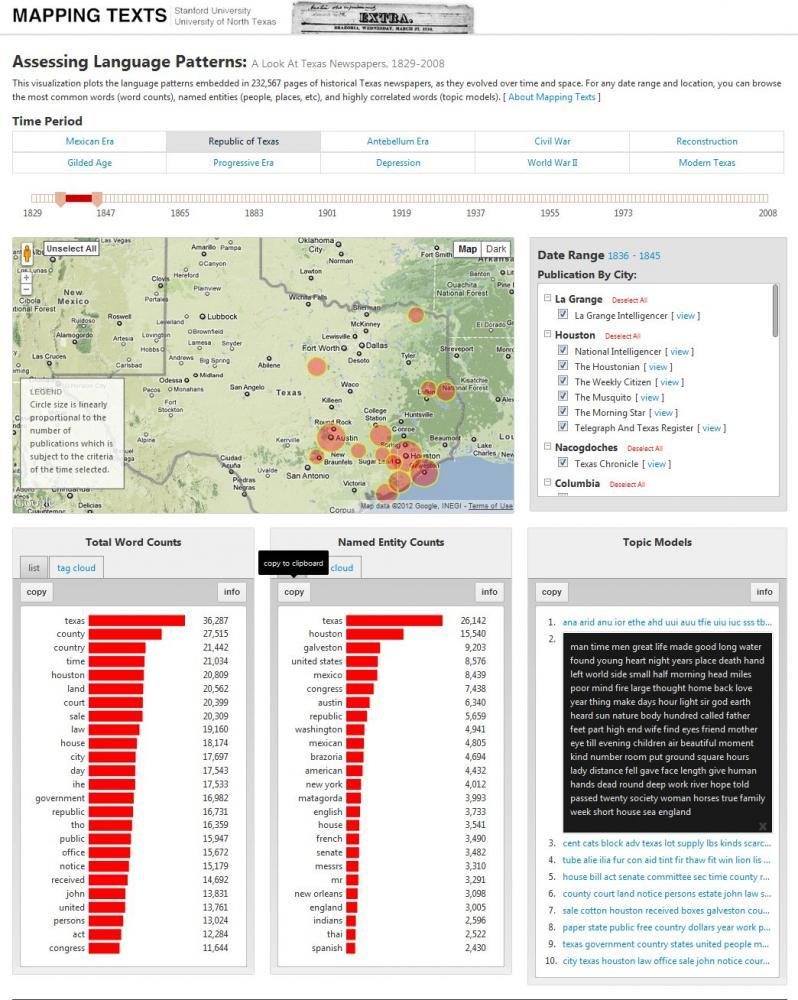
Image courtesy of University of North Texas / Stanford University
The Mapping Texts project, a collaboration between the University of North Texas and Stanford University, recently released two new interactive visualizations that allow users to map language patterns embedded in 230,000 pages of digitized historical newspapers from the late 1820s through the early 2000s.
Sponsored by a Digital Humanities Start-Up Grant (HD-51188-10), the project team—led by Andrew J. Torget and Jon Christensen—spent the last eighteen months experimenting with developing new methods for finding and analyzing patterns embedded in massive collections of historical newspapers.
The primary goal of the project, explains Torget, “was to find new ways for people to make sense of the overwhelming abundance of information being made available in the digital age. Historical newspapers are being digitized at an astonishing rate. The Chronicling America project, for example, now provides access to over four million pages. People are going to need new ways to make sense of such massive and rich collections, because when you can explore hundreds of millions of words a basic text search simply isn’t enough.”
The project focused on a collection of historical Texas newspapers digitized by the University of North Texas Library as part of NEH-funded National Digital Newspaper Program (and now available via the NEH/Library of Congress' Chronicling America site). Together, the UNT and Stanford teams experimented with ways to combine text-mining (to find patterns in the collection) and data visualization (to make sense of them) in order to produce new visual indexes of the newspapers. “By mapping the contents of these newspapers across both time and space, as well as the quality of the OCR digitization,” says Christensen, “we aimed not just to reveal patterns and surprises in the collection that you simply would not otherwise see, but also to give researchers a concrete sense of what information is and what information is not available to them in a large digital archive.”
The results are two interactive visualizations:
(1) “Mapping Newspaper Quality” maps a quantitative survey of the newspapers, plotting both the quantity and quality of information available in the digitized collection. Through graphs, timelines, and a regional map, users can explore the quantity of information available for any particular time period, location, or newspaper, as well as the quality of the digitization of the newspapers. By clicking on individual newspaper titles, users can also access the original newspaper pages.
(2) “Mapping Language Patterns” maps a qualitative survey of the newspapers, plotting major language patterns embedded in the collection. For any given time period, geography, or newspaper title, users can explore the most common words (word counts), named entities (people, places, etc), and highly correlated words (topic models), which together provide a window into the major language patterns emanating from the newspapers. Users can also click on individual newspaper titles to access the original documents.
One thing I find particularly compelling about this project is that since all the National Digital Newspaper Project pages are created using the same standards, work like the Mapping Texts project could, in theory, scale beyond the Texas newspapers to other states or even nationally. As we scan millions of pages of newspapers (and other humanities materials) new methods for searching and analyzing the materials will become critical to scholarship.
To learn more behind-the-scenes information about the project, check out their NEH Project White Paper.

